Solareum
Energy, made visible.
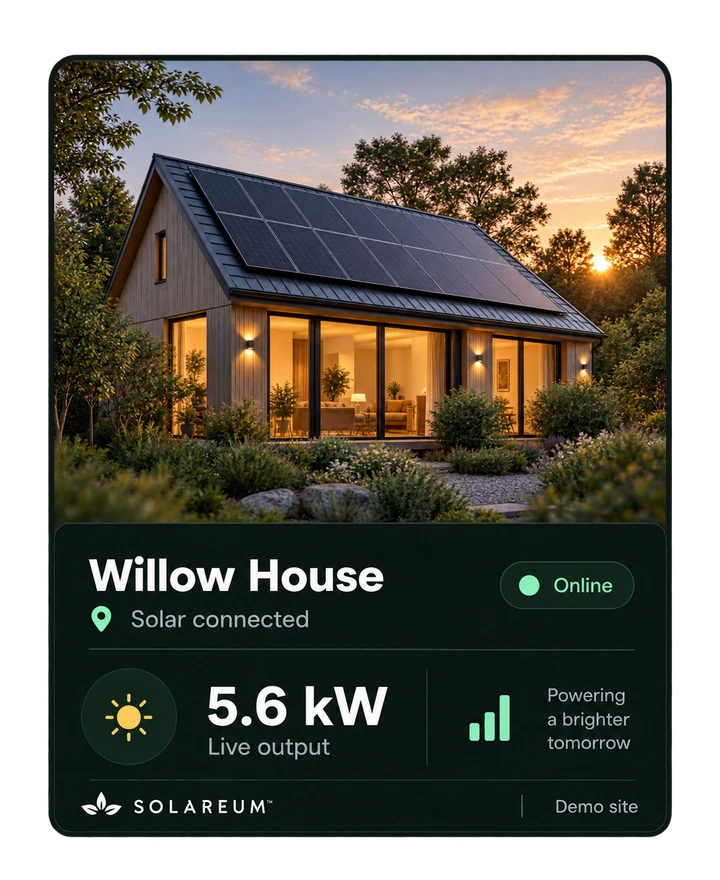
Solareum is a Layer 1 blockchain validated by renewable energy. I built the web dashboard where owners connect their panels and batteries, watch them report every three seconds, and see their generation recorded on chain.
- Solar
- 5.6 kW
- Home
- 2.1 kW
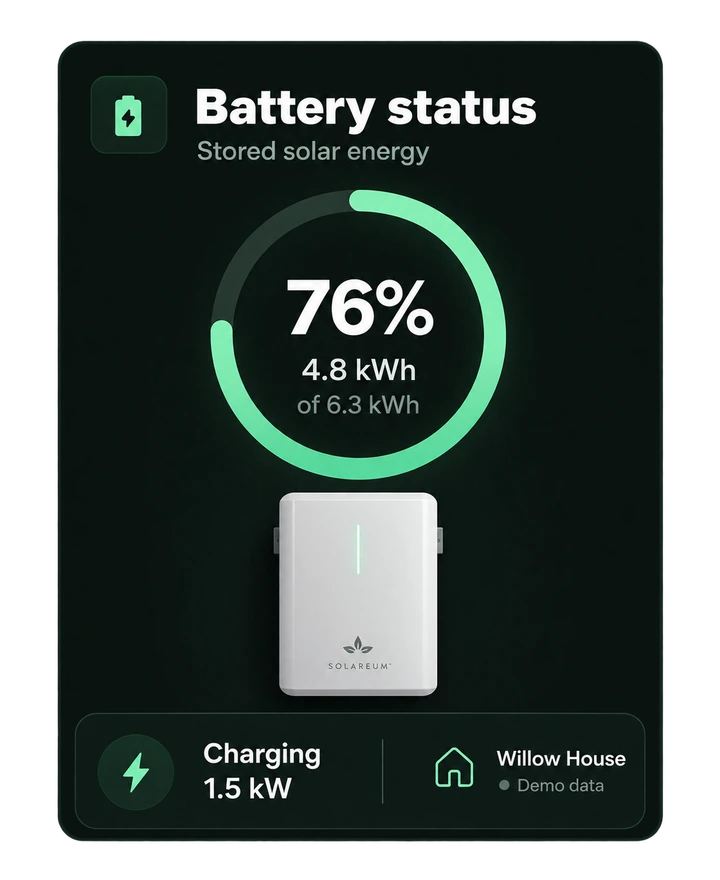
- Battery
- 1.5 kW
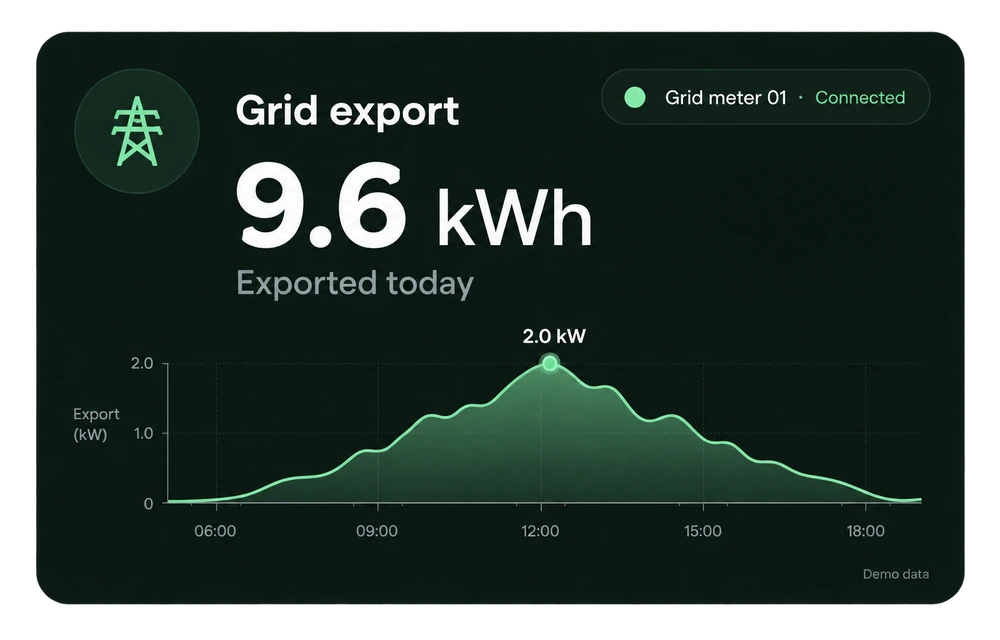
- Grid
- 2.0 kW
About Solareum
Solareum is a Layer 1 blockchain that runs on renewable energy. Its Proof of Generation consensus rewards people for producing clean power, and records that production on chain.
I built the dashboard that system owners use day to day: connecting devices, the network and home energy views, charts across six time ranges, and the testnet wallet where generation rewards arrive.
- 3sBetween dashboard updates, per solareuml1.io
- 100%Renewable validation, per solareuml1.io
- 28,800Readings per site, per day
- 6Chart ranges, minutes to years
One screen for the whole house
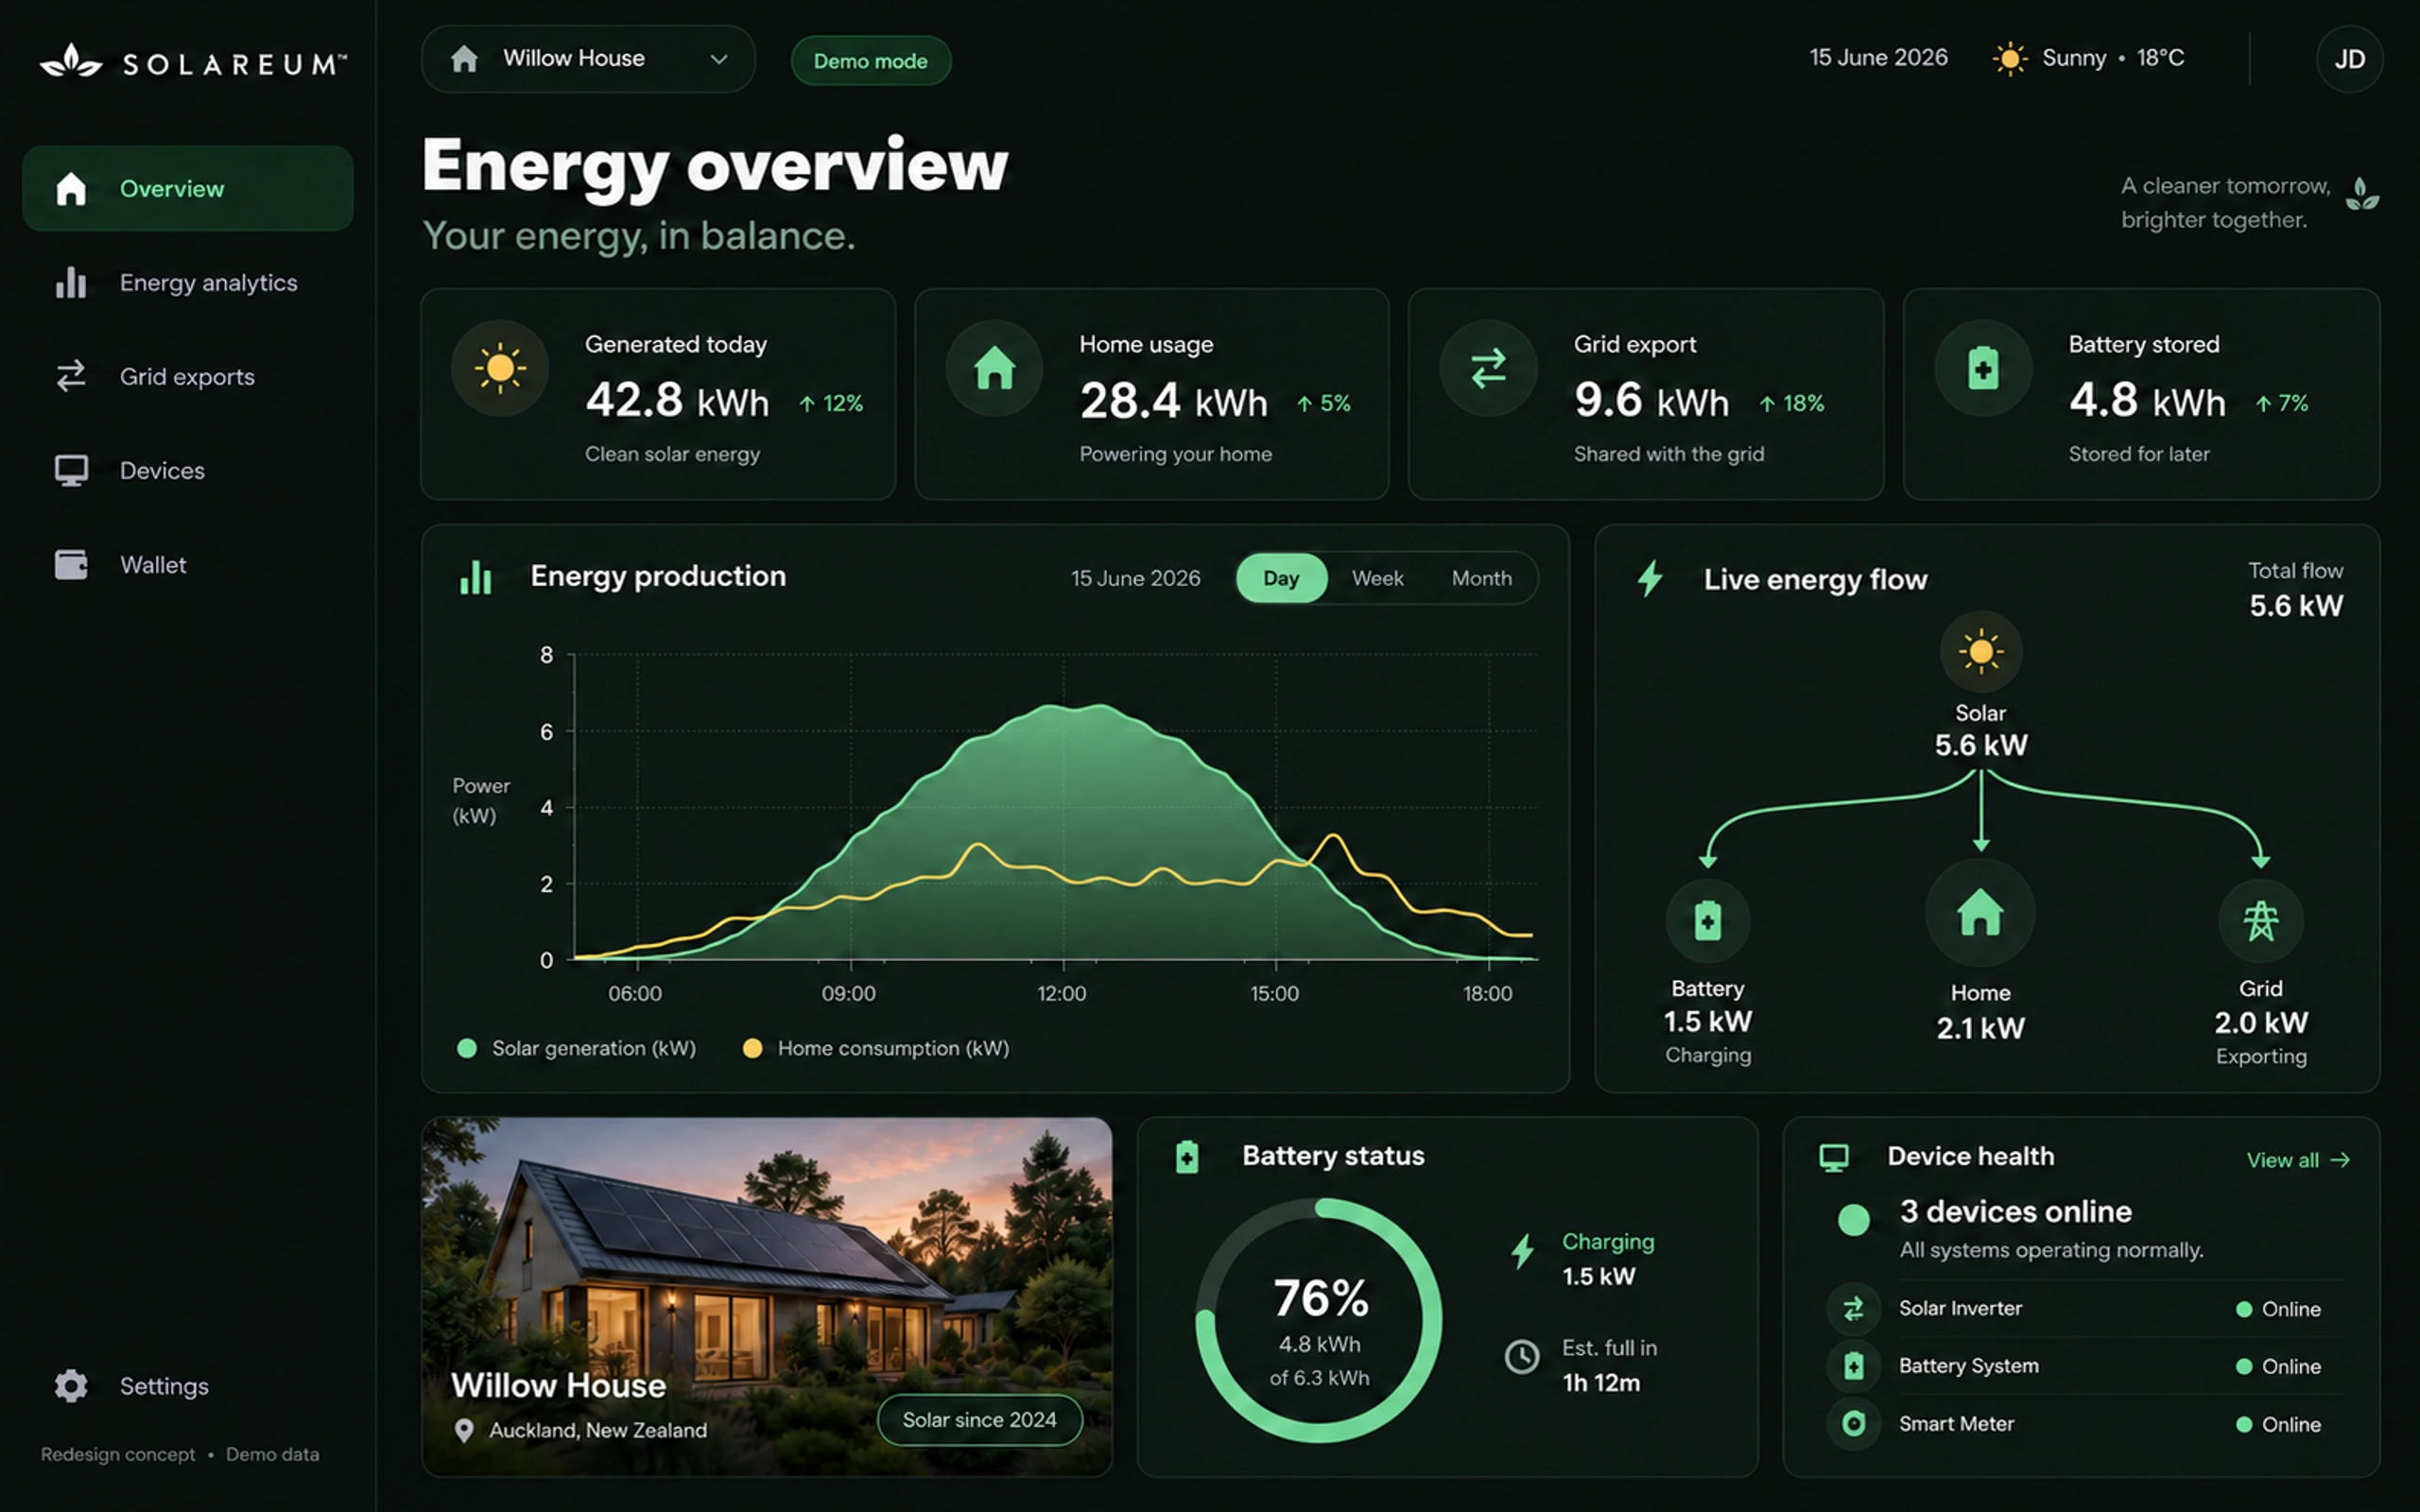
The overview answers the question owners open it with: is everything working today? Scroll to walk through it.
Energy in, energy out
The flow card shows where the panels' output goes right now: into the home, the battery, or out to the grid. After sunset the arrows turn around, and the battery and grid carry the house.
Every node reads from the same set of readings, so the two sides always balance. Drag the sun through the day to see it.
5.6 solar = 2.1 home + 1.5 battery + 2.0 grid kW
Minutes to years, twelve bars at a time
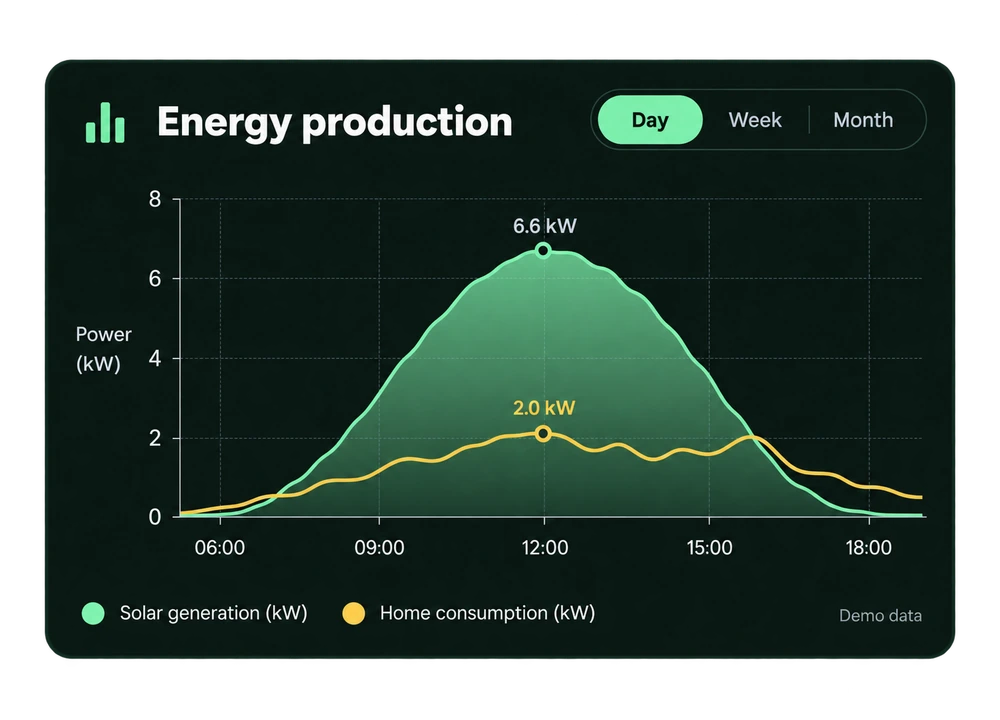
A site that reports every three seconds produces 28,800 readings a day. No chart should try to draw that.
Each range asks the API for a bucket size instead: five minutes, an hour, a day, and so on up to a year. The rollups are computed ahead of time, so switching from Hours to Year is one small query.
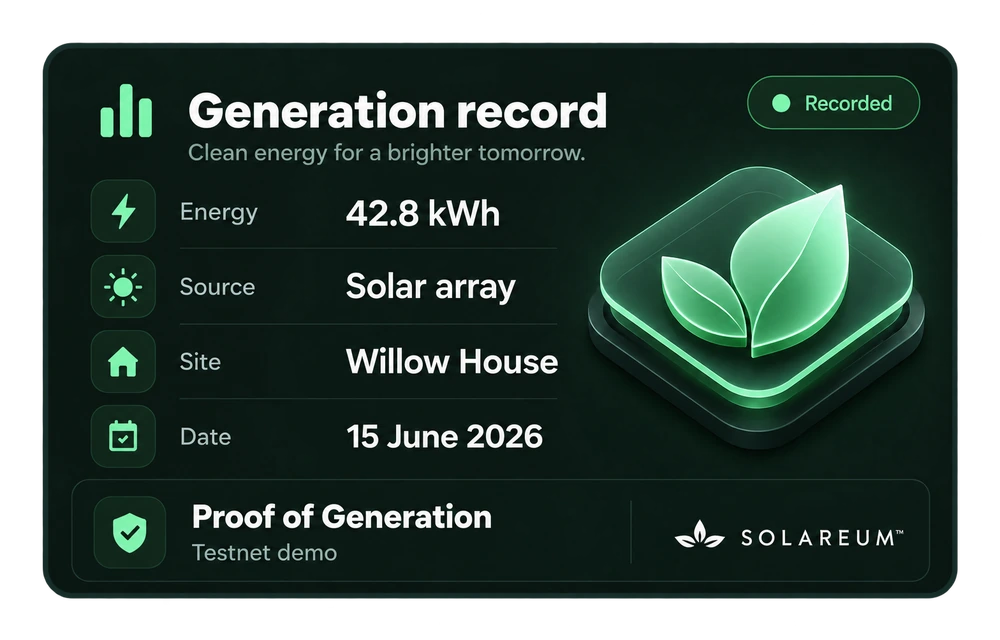
- Generated
- 42.8 kWh
- Span
- 06:00 – 18:00, 15 June
- Bucket
- 1 hour
- Readings
- 14,400
Plug in a battery, see it in seconds
Owners add a device from the dashboard and authorise it once. After that it reports with the rest of the site, and the dashboard polls every three seconds.
A device that misses its window is marked stale, so nobody reads yesterday's number as today's. Try pairing an EV charger.
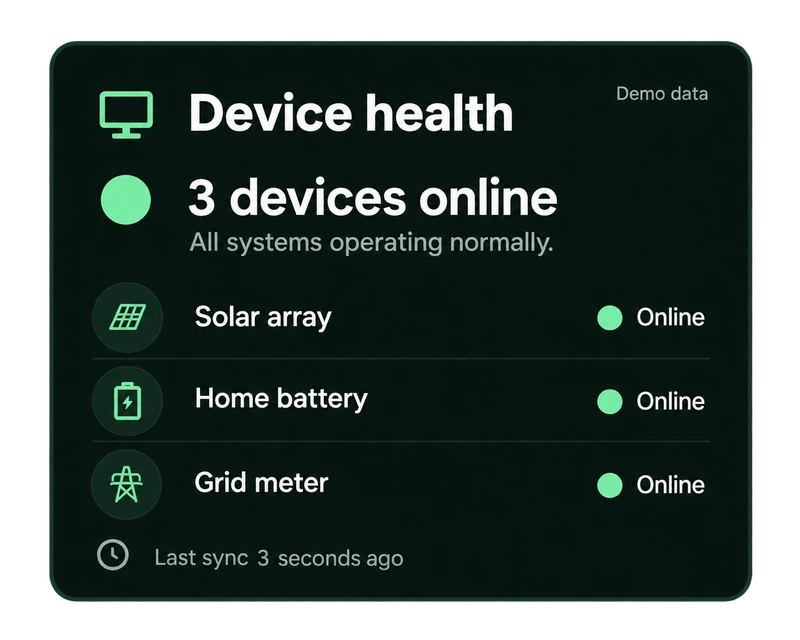
- Solar arraySolar PV5.6 kWOnline
- Home batteryBattery storage76%Online
- Grid meterSmart meter2.0 kWOnline
- EV chargerWall charger…Pairing
Generation becomes a record
Proof of Generation authenticates metered output from renewable sources and writes it to Solareum's own Layer 1 as generation records.
Each record pays the site's wallet in JUL on the testnet. The wallet lists every reward beside the reading that earned it.
- #1,204,32812 tx · PoG ✓No site records
- #1,204,3298 tx · PoG ✓Willow House · 0.8 kWh
- #1,204,33015 tx · PoG ✓No site records
- #1,204,33111 tx · PoG ✓Willow House · 1.2 kWh
0xDEMO…20261,240 JUL- Generation rewardBattery cycle record · +8 JUL
- Generation rewardSolar energy record · +12 JUL
- Generation rewardGrid export record · +10 JUL
The dashboard, screen by screen
Redesign concepts of the owner dashboard, with a demo site and demo data. Select a screen to see it full size.
Eight cards, five screens
The redesign is built from a small kit of cards that each make sense on their own. The battery, flow, and record cards move between the overview, analytics, and wallet unchanged.
What it runs on
Dashboard
- Next.js
- React
- TypeScript
- Tailwind CSS
- Zustand
- TanStack Query
Charts & maps
- Recharts
- react-simple-maps
- date-fns
Wallet & chain
- wagmi
- viem
- WalletConnect
- EVM JSON-RPC
API & telemetry
- Node.js
- NestJS
- PostgreSQL
- TimescaleDB
- Redis
- AWS